🎯 Why You Need to Stop Tracking These 5 Metrics

This article was written as part of the SEMrush Big Blogging Contest.

One of the things that going digital does to any brand, is that it suddenly gives access to a lot of data. Data, that opens up a world of possibilities.

Possibilities which had not earlier been anticipated or even thought of. Somehow, it propels teams to start thinking in terms of achieving certain data metrics … and that seems to justify the sheer obsession with data.

Continue reading “🎯 Why You Need to Stop Tracking These 5 Metrics”

More information about Samara Oblast

I had blogged about getting traffic through bots leaving referral signatures, and it seemed as if the whole internet saw this happening on their sites. After I blogged this post, Moz.com came out with suggestions on putting filters on Google Analytics to clear our your analytics data.

Continue reading “More information about Samara Oblast”

2018, the year of numbers

The year of analytics

I have been talking about data and analytics for quite some time now. So much so that, I have shifted from doing development as a service (at 13 Llama Studio), to agency as a service (at 13 Llama Interactive). The reason behind this was to capitalise on my love for data analysis and build an organisation that works with data instead of opinions.

From Full Service to Data Analysis

One of the main things that I have been doing, is never say no to anything that lands on my work desk. This is a good thing, since you can pretty much get started as a service based business and do a variety of things.

This, however, is a bad thing since it takes you away from your chosen area of work. In my case, that’s analytics.

We started off as a Full Service Digital Agency and did everything under the sun. Websites, logos, app development … product development, incubation even. Whereas, it’s a fantastic way to keep busy, it did not sate my need to work with numbers.

Saying No

The year 2017 was the year of No. I have been steadfastly refusing to engage with anything which did not involve numbers. So much so that, the organisation that I had so loving built has become an empty shell, almost.

While, this lean attitude is good for companies where there is a lot of waste, taking this to near starvation levels also does not help. Unfortunately, I keep getting such insights only as hindsight :)

What 2017 did offer was a massive consolidation of business interests, which was a good sign. It also taught me the value of human engagement and how business engagements were closely related to the simple human interactions.

Focus on Measurements

I had been going on and on about measurements for some time. I realised that without getting into this completely in your system, you cannot really appreciate this thought. Here’s a quote from Swami Vivekananda –

Take up one idea. Make that one idea your life — think of it, dream of it, live on that idea. Let the brain, muscles, nerves, every part of your body, be full of that idea, and just leave every other idea alone. This is the way to success…

To fully understand and appreciate what this means, do go through this interpretation by Srinivas Venkatram.

It took me some time to fully get this, and for me that meant focusing on analytics. It did not really mean saying No to different engagements. It means applying my love for data and analysis in whichever engagement to drive value.

2018 for me, represents just this. A year where using measurements I would drive value. Be it in product development, be it in promotions.

Using Intelligence reports in Google Analytics

It’s always a pleasure to use a product that keeps evolving. The possibility of discovering a new feature that’s been recently launched, and the happiness of seeing the applications of that new feature is what keeps me coming back to the product. Google Analytics is one such product for me. Slowly and steadily, they have evolved the product so as to give the free tier users a taste of what Google Analytics Premium (GAP) offers.

Intelligence reports have been around for quite some time now. However, what GA has done in the recent times, is give the user the ability to articulate their question in natural language, and use natural language parsing to understand the question and present meaningful answers back to the user.

Smart and Intelligent reports

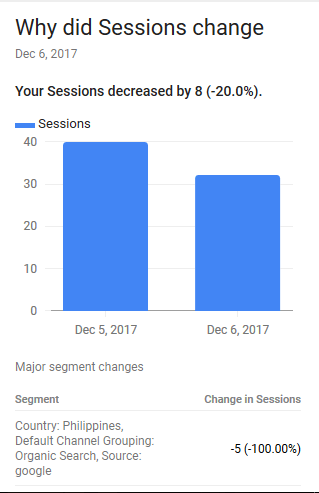
Here’s an example of how these intelligent reports work. Suppose, I see a spike in traffic yesterday, and I want to know the reason why.

Normally, I would go to the Source/Medium report in the Acquisition section and see which of the sources have had an increase in traffic since yesterday. However, what intelligent reports does is this –

Intelligence Reports in Google Analytics

So what’s the big deal?

The big deal is this. If you are not comfortable with the analytics interface or are not savvy with using the right set of reports for fetching your data, then the intelligent reports are a rather user friendly way for getting access to perhaps the right data.

Notice, in my example, the segments that intelligent reports ended up reporting was a rather advanced segment (Organic traffic, Country-wise).

To reach there, I’d have to go through atleast two separate iterations. This was given to me rather quickly.

Cool, are there any disadvantages?

There is one huge disadvantage. The data given is prescriptive in nature.

You are relying on Google Analytics to give you the right data.

While, for most use cases, the data may not be that important, but for someone whose living runs on getting the right numbers, this may not be enough. It’s good enough to get you started in the right direction though.

Why do I still like it?

The nature of querying is also pretty great. Now, business teams can directly dive into Google Analytics instead of having to wait for an agency or an analyst to make sense of this data. That’s power to the people!

This means, a lot more people can now engage with analytics and take the right data driven steps for improvement.

A Success/Failure method for Analytics

When identifying the Key Performance Indicators (KPI) of your business, it makes sense to choose the proper measures of success. I have written about choosing the proper measures of success in the past. Since most of the work that I do is in the realm of the web, the principles via which we operate and do reports are more or less the same.

The only thing that changes is the conversion … or the success metric. In other words, the reason for which the website is built, the purpose of that site. Hence, the measure of success approach works.

Designing for new paradigms

However, what would happen if the product being built is not meant for the web, or was not based on the same principles? How would we go about identifying metrics and actionable reports.

For that we would have to go to the very reason why we need analytics.

The Purpose of Analytics

If I were to define the reason why we use analytics in any product, it would be to –

  1. Identify the wins, celebrate them and try to find the rules which get us more wins
  2. Identify the failures, and figure out ways to fix those failures so that we can improve

This view helps us do two things primarily, one to find out and scale the good things, and the other to find out and weed out the bad things in our product.

To do this, we would need metrics (or KPIs) that would indicate a success or a failure.

Measures of Success

The measure of success metric help in identifying the clear wins and celebrating them within the team. These also help in figuring out what worked for you in the past and on how to re-create those wins. One definitive thing that needs to be done (and I have learnt this the hard way), is that wins or measures of success metrics need to shared in a broader audience to give a sense of purpose to the entire team on what they are working on.

A good measure of success is task completion rate, or conversion rate, or profitability.

Measures of Failure

The measure of failure metric help in identifying failures within a certain activity. These are also metrics which help in identifying opportunities of improvement. Measure of Failure metrics should help us root out problems within our current design/product. I say root out, because once you identify the failure, you have to act and ensure that the failure does not happen again.

An example of measure of failure could be bounce rate.

Unlike measures of success, measures of failure may not be shared with large teams. Rather I feel (and I am want your opinion on this), that they are much more effective when communicated to the right localized teams.

Importance of Context in Analyzing data

Recently, I was analyzing some user generated data in a mobile app. The app was sending content on specific categories to a niche audience, and at the end of each content piece, there was a simple 5 star rating feedback for users to rate the piece.

The assumption that the design team who thought of this was that the feedback data was an objective metric.

Objective metric for Subjective behavior

Unfortunately, the behavior of users and how they understood the content piece is a very subjective topic. By subjective, I mean to say that for two different users, the value they would associate to the usefulness of the same piece varies.

We could always say ceterus paribus, but I would say – “Let’s not fool ourselves here”.

In the world of subjectivity, ceterus paribus doesn’t exist

There could be so many factors that are associated to my giving a 5/5 to a piece v/s 4/5 to the same piece, that in the end, I’d be forced to say it depends, and then list out of a whole new set of variables.

Slicing the Data with new variables

This is a problem. Since, my existing data set does not have these new variable. So, from analyzing – now I am back to collecting data. To be frank, there’s no end to this cycle … collect data, realize that you might want more data and rinse, repeat.

Where do we divine the new rules and new variables? We start from the context.

Ergo, the simple and freeing approach of the answer to the questions we were looking for in the data, sometimes lies partially in the data points, and partially in the context.

Let me illustrate this

Let’s take a fairly popular metric – Bounce rate.

Now, if I were to say that my website’s bounce rate is 100%, what would you say?

Sucks, right??

.

.

.

Now, if I were to tell you that my website is a single page website where I want my users to watch a product launch video. That bounce rate suddenly pales and aren’t you itching to ask me about the number of users who played the video upto a certain point?

If you have been working with Google Analytics, then some of you might even suggest that adding a non-interaction event in GA when the play button is hit.

One more example

Let’s take one more metric. Pages/Session to measure how much content the user is consuming on a site.

.

.

.

Let’s see this in a different spiel. A user is on your site, searching for content and is not able to find what he wants, and keeps visiting different pages. After going through 8-9 pages, he finally gives up and leaves the site. That 8.5 as pages/session now doesn’t seem that sexy now does it?


Understand the context

Therefore staring at a pure data puke may not help. Understanding the context under which that data was collected is as important as going through excel sheets or powerpoint presentations.

TL;DR – Data without context is open to too many interpretations and is a waste of time.

Shifting to _utmz to _ga

Some years back I had written about the __utmz cookie that Google Analytics uses to identify source attribution for visitors. If you are interested in reading that post, click here on Understanding the __utmz cookie.

Google evolves beyond Urchin

Google Analytics is based on the Urchin tracking management system and has been improving on that system over a period of time. As I have seen this product evolve, and many more features that were not there in Urchin … one of the major changes has been in the usage of cookies.

That makes my earlier post defunct.

The utmz Cookie

The utmz cookie used to contain the information about where the user has come from, which campaign, source and medium did the user react to arrive at the site. This information could be read and stored in a separate system (such as a CRM whenever a lead is captured). This could help in attribution of paying customers, and bring in all the crunchy goodness that you wanted.

Unfortunately, the utmz cookie no longer exists. The cookies have changed, if you are interested in know which cookies Google Analytics uses now, you can read this support article.

Where does that leave us?

So how do we go about finding more information about the user. This information is now not readable. However, what information we have on hand is a unique identifier of the cookie. That much still hasn’t changed.

So let’s take a look under the hood shall we,

The _ga cookie contains a value. This is the client id of the user. If you see the cookies collection, there are multiple _ga cookies, however, when you match it with the domain column, for every user – domain combination, there is a single _ga cookie.

This cookie is accessible by your server side script as well as your client side JavaScript. Therefore, we can get access to the _ga cookie value and store the client id within.

What is a client id?

To understand this, let’s go to Google Analytics. In GA, under the Audience section, we have a User Explorer report. Here’s a screenshot from my GA –

Check the value – 129754452.1496423206

This is available in the _ga cookie as well as in the user explorer. I can now identify specific users and leads in my CRM based on their client ids.

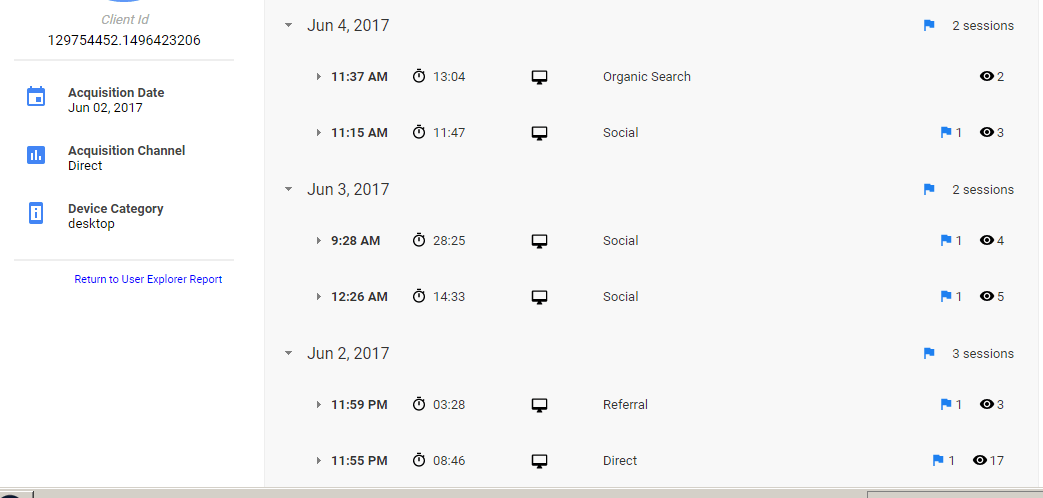
Therefore, I can even start checking their user behavior on the site, like so –

This is how the user has been visiting the site over a period of time. Notice the source is changing for different visits.

In a world where I would have been storing just the final source in the CRM, now I have a much more detailed view of how the user keeps coming to my site. This allows me to explore other attribution models and share the credit of the user’s conversion across channels.

This brings me one step closer to the World of And.

The World of And

In case if you haven’t already watched this, you need to watch this –