Nitropack review

Those of you who are running some sort of a content management system (CMS) for your websites would be familiar with the problem of improving the site loading speed through different methods. From the age old caching methods of using op cache module, to using an application specific caching method such as WP-Supercache for your WordPress installations, the sheer variety of solutions out there is a lot.

For a non-tech webmaster (these days, this term seems like a conundrum!), it becomes difficult to choose. At the end of the day, what one ends up going for is how fast the website is loading and more importantly how is the web performance of the site.

Let’s take a look at what are some of the common factors that any webmaster would like at for their caching solution.

Server site rendering time

This is effectively how fast is your server giving the response on the browser. Let’s say that you are running a blog on a small instance or a shared hosting solution. This would usually have limited resources associated with it, be it computing or memory. For instance, currently, these pages are being served off a 512 MB droplet.

Needless to say as your traffic increases, these limited resources are then not enough to address the entire traffic and thus, the response time for all your visitors starts to increase. A simple solution for these problems could be to bump up the hardware and increase the computing and memory being made available for the server. The computing speed is obvious, but why the memory you might ask? Well, since most web servers are softwares running on servers (for e.g Apache or Nginx are the servers most commonly used for WordPress), these software processes have to run on the server. The more the traffic, the more the number of processes.

If you are running WordPress and are facing a load of traffic, and if you are running your database on the same server, then you might sometimes be seeing images like the one below –
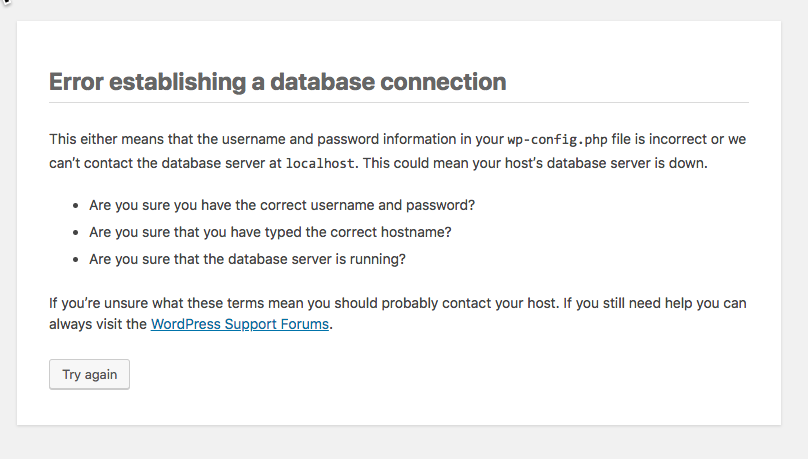
MySQL error with WordPress

Seems familiar? A common reason for this is when there are too many apache2 processes and not enough memory to handle all of them. The server promptly terminates the other processes, including the MySQL daemon.

Caching to the rescue

This is where server side caching comes to the rescue. Take this blog post for instance. How many times in the week am I going to edit this? Not many right?

In which case, instead of the PHP script executing every time, why can I not serve the static (HTML pre-rendered) version of this post?

WP-Supercache does a good job as a plugin to do this, however, in this case, for supercache to execute, the WordPress PHP scripts are still executing. How can we stop those?

Another option would be to run caching at Apache or Nginx’s level. This is a much better approach since instead of calling PHP scripts, the server will serve the last known cached static file. The problem with this approach is cache management and storage.

With a small server, you may not have a lot of storage, and if you have been maintaining a content heavy site, then caching all pages might be a storage intensive process. The expectation from your instance’s compute power also increases.

This is where you will find reverse proxy servers shining.

Reverse proxy servers

A reverse proxy server is a server that sits in front of the web servers and forwards client requests. One of the older versions for PHP based websites was Varnish. Nginx also offers this, and newer versions of Apache also do offer this functionality.

What the reverse proxy does is for each request, it caches the response from the down stream server and serves that response for each subsequent request. Think of it as a smart cache manager that sites seamlessly between your CMS and the user.

Traditionally, these were a bit difficult to setup, and therefore were the domain of only the tech oriented webmasters. However, of late, there have been a couple of smart SasS based reverse proxies, and that’s what I wanted to write about.

Cloud-based reverse proxies

A cloud based reverse proxy is a reverse proxy server that’s not on your network/server infrastructure, but rather hosted as a separate service that you choose to buy.

I had initially tried Cloudflare, but wasn’t really impressed with the results. There were a couple of Indian service providers as well, but the outcome wasn’t that great.

Then, one of my colleagues pointed me to Nitropack. Getting started with Nitropack was a breeze and I could easily set this up. There was also a plugin to be installed in my WordPress setup and that’s about it. Nitropack even had a CloudFlare integration (since I manage my DNS on CloudFlare), where it made the relevent DNS entries and I was able to use this without too much of a hassle.

I am currently on the free plan, but the immediate impact on my server response times, and my web performance has been substantial.

If you are a website owner and if you have been harangued with web performance issues, do give this solution a try. It makes a sufficient impact on your response times.

Getting started with R

Back in 2017-18, I started teaching a course in a business school – instead of including a lot of theoretical frameworks, I opted to go with the basics and some implementation and tooling concepts. One of the tools that I chose to teach was how to use R in business analytics.

For those of you who do not know R, here is a helpful wiki article on the same.

Teaching what is broadly a scripting language to graduate students who havent written a single line of code is a humbling experience. You cannot take concepts such as variables, control loops, libraries as taken for granted since the exposure to these has been minimal. So how does one pack all that information into simple, usable instructions?

This is what I did.

Use free MOOCs

For students to understand the basic concepts of R – vectors, assignments, matrix, simple functions, etc, I prefer free MOOC such as the Introduction to R by Datacamp. The course is simple, it has the R ide within the practice area and allows for easy practice sessions and a playground to test your scripts while you are reading through the course material. I find this super useful for application oriented courses.

Right before jumping into the actual concepts of how R can be used for business analysis, this basic introduction course helps in establish a good solid base for participants who want to get started with R.

Use multiple datasets

I typically start these sessions with a financial data set. Credit card usage statistics, or some such information. However, I realized that students do better if they are able to relate to the date. During the length of the course, I found that switching to a course such as movie data (and thanks to IMDB for opening up their database) or cricket data made a lot more sense. It became easier for the participants to apply conceptual learning on the data sets.

See and Do

We used to incorporate several practice sessions in the class. This included getting the basics, writing scripts and getting started with R.

Some of the easier ways are –

  1. Use the R-Studio IDE installer
  2. Use the Anaconda Navigator
  3. Use an online tool like Rdrr

6 months of lockdown

As I write this after nearing the 6 months mark of lockdown, I cannot help but think at looking back at how things have changed in the last 6 months or so.

  • Work from home is an accepted norm with remote working at an all time rise. The organizations that could slide into this mode of working have also started realizing the benefits of allowing teams to operate from home. Any teething troubles that were there have been ironed out and I am see teams of all functions coming together on Zoom/Hangouts and making it work.
  • Reverse migration has started. A lot of this working class who can work remotely has opted to move back to their native places. Just to give an example, out of my team of 8 – only one has chosen to stay in the city … the rest are safely back at their native places across the country.
  • Internet penetration and mobile services are at an all time high. The demand for Jio has never been higher with this working class scrabbling to ensure that they have steady connections at home. I see this audience’s demand in Tier-2 and Tier-3 cities ensure that brands and the government focus on building out the infrastructure in remote cities.
  • This would lead to some normalization between demand and supply of all goods across higher and lower tier cities. Take Mumbai for example … in the suburbs or in Mumbai proper, it is hardly a case when you see an electricity outage. As you go outwards, you will start seeing specific load shedding hours and schedules. In the Raigad district, there is atleast one day a week when there is no electricity. As the working class goes back to these cities, either the demand for inverters will go up or the respective local governments would be petitioned to increase the quality of lifestyle.
  • Environment conditions across all cities have drastically improved, the Mumbai air feels cleaner, cooler and taking a walk doesn’t seem oppressive.
  • Organizations whose engagement models involved a lot of physical interaction have started discovering alternative methods and workarounds. Dentists have started using full-body kits, delivery boys have established clear package hand-off protocols, restaurants have started opening up with lower floor space utilization.
  • Cost of basic services and commodities have slowly increased. An annualized inflation of 15-16% looks to be on the cards and the common man is going to bear the brunt of this. Any initiative the government is going to take is only further going to exacerbate this.
  • Industries that have been doing well since lockdown –
    • Food Deliveries
    • E-commerce
    • Agri-tech
    • App enabled services
    • Edtech
    • Fintech
  • Communication apps are at an all time high. Zoom has made it to the top 10 websites in India according to Alexa.com
  • OTT platforms are raking it in with a lot of the younger audiences looking at their smartphones for entertainment. Since there haven’t been any theatre releases, all the movies that were scheduled to be released have started being covered on the OTT platforms. A quick glance at the above list by Alexa informed me that Netflix, PrimeVideo and HotStar were all in the top 20.
  • Big tech firms are going all out to change the way things are. Google pretty much gave all schools free access to Google Classroom. Both my children are using this for their new term this year.

As things start settling down from this massive change in life, I see a resilience being shown by businesses as they start figuring out a way to live and thrive in this economically challenging environment. As a technologist, I see a large need to automate a lot of business processes to keep the wheels of the industry turning.

This is what will keep the world going round.

Building your Custom Connector on Google Data Studio

Building your Custom Connector on Google Data Studio

Disclaimer – This is going to be a slightly technical post. If code scares you, then I’d suggest you skip this one. However, if data excites you, read on fellow adventurer!

When Google launched Google Data Studio, I had written an in-depth post about how one can create dashboards in Data Studio and some of the easy to use dashboard templates that Data Studio has to offer. As the product evolved, one of the most powerful features that this product had to offer was the ability to create custom data connectors to your own datasets.

What does a custom connector do?

A custom connector enables a user to access their own data source within Google Data Studio. Let’s take an example of a marketing research associate who wants to present her findings. One approach she could use would be to put all that data in Google Sheets, and then use one of the in-built connectors.

However, what would she do if her data set was large and does not fit in Google Sheet or Excel? Or if her data set included multiple surveys which are inter-related to each other?

What if this data was in a database, or available as an API? This is where the custom connector for Google Data Studio works.

I wrote my first connector a year back, and I had to do some digging around. I thought that I should pen down my notes so that more people can do this much more easily. Here are my notes for the same.

Building a custom connector

Before you jump into the implementation bit, know that this is based in JavaScript and you need to be comfortable with Google App Scripts. It’s okay if you do not know this, but JavaScript is a must.

Google has official documentation on the developer site of how to build a Community Connector, this is a pretty good resource to start. It has a step by step video and instruction guide as well.

Let’s look into what makes different parts of a connector, here is a link to a sample connector code on Github.

Community Connector sections

Each community connector is a separate Google Apps script that you deploy using Google App scripts. The connector is in itself made of the following sections –

  • Configuration section – This is to flesh out all the meta information about the community connector. Use this section to take any inputs from the user e.g API Secret and key if you don’t wish to store this in your code.
  • Authentication section – This is to authorize the app script. If your data is lying behind a secure mechanism, then use this section to authorize the script to access the data. This supports OAuth2 as well.
  • Schema section – This is used to define the structure to the data you are importing into Data Studio. Use this section to outline which fields and what data types are they. You can also add more information on what kind of aggregation do you want this field to be have (Sum, Average, Min, Max, etc).
  • Data section – This section is used to fetch the data that you are importing. Use this section for data validations or if you want to do any last minute data tweaks (e.g date conversions from string to date).

That’s all there is to it. Now, let us get into the actual flow of the script.

Connector code flow

When you are writing your connector, be sure to go through the developer reference first. In your script, you will have to include the following functions –

  1. getConfig() – this returns the configurable user options for the connector, this will be shown to the user when the user is adding the connector to their Google Data Studio accounts.
  2. getAuthType() – this is the function which is used to check if any authentication is required. If OAuth is set, then the community connector interface would check for the OAuth details
  3. getSchema() – this returns the schema of the data that is being access, this will be shown to the user when the data is being explored (where we can see the dimensions and metrics).
  4. getData() – this is the function which is used to access the data, the data format that is expected is outlined here. Normally, it is advised that the programmer write a separate function for fetching the data, a post processing function for setting up the return values, and finally call those in the correct order in this function.

Do note, that these functions will be called in the same order as they are listed. As long as you have these functions in your code, you have a functioning connector. Once you have this, you will have to deploy the code.

That’s it. Now, add this community connector to your Google Data Studio account, and make the reports you want to!

Working with markdown and gitbook

working with markdown and gitbook

For those of you who don’t know yet, I have shifted tracks to heading a tech team in a start-up. This firm focuses on helping first time home buyers with the largest hurdle in home buying, the down payment. HomeCapital is India’s first home down payment assistance program.

At HomeCapital, one of the immediate challenges that I had to face was to understand a myriad of requirements from speaking to the operations team, to the business analysts, to the developers, to some of the customers and even to some of our investors.

Since, the approach is that of a technology platform, it also means that the team had to start worrying about multiple systems all at once. Deciding to move away from one huge monolithic system to a micro-services based architecture was natural.

How does one manage loads of Micro-services?

A major challenge with a spread of micro-services was that the management overhead of systems went up. Different services were in different repos, in different languages and hosted in different methods. Yes, there was an API gateway on top to present a uniform access method for all, but the code management and documentation was a challenge.

Thankfully most popular versioning systems have solved the code management issue. One of the first steps I initiated with this was using the README.md to quickly jot down what the service is supposed to do, and how it functions. This was created more from the point of a new team member who wants to get started with the respective service. You need to be comfortable with Markdown for this. I’ll get to markdown in a minute, but this was a great starting point for me to understand what a developer really needs in the documentation.

As a person overseeing multiple services, it was essential for my team members to quickly pick up the bare essentials and use the documentation available. Having a small entry point in the repo is a perfect way to give access without creating too formal a structure. My choice of working with markdown was made.

What is Markdown?

In case if you do not know what this is, then you mostly haven’t edited a wiki. Markdown language is a super lightweight language that allows one to quickly convert the text into a rich formatted document (such as HTML, PDF, etc). To read more about this, head on to the Wiki on Markdown.

Try practicing using Markdown for some time and you will realize its almost as simple as using notepad or gedit to take down your notes. It also helps you to create a more complex structure and is super flexible for future use-cases.

Generating a usable README.md

For those of you who want to try this out, hop on to Make a README and see the basic placeholder sections needed to make a developer friendly file.

I had by this time quickly written these files and was happy that at least I had some formal documentation available in a system that was fast growing. A side note here – <rant> In most rapidly evolving systems, people often take decisions that they regret later on. This technical debt although is meant to be avoided, but often it just can’t be avoided. As long as you are willing to come back and clear the debt, it’s fine. You could re-think your approach and do it faster in a correct fashion – but then you need to be a lot more mature and I just don’t see that developer maturity yet. This side note will need to be expanded into a separate post of it’s own </rant>

What to do with a cart load of README.md files?

Quickly, I had many individual standalone files sparsely connected to each other. While this was sufficient for a developer to get started, this did not fully cover the breadth and width of the system.

This is where my past experience of working with the WordPress India community helped. The community is building an independent document made of such .md files using gitbook. Gitbook used to be a CLI based command that you could install on your machine and use to build a developer website. This using the very .md files that I now had.

At the time of writing this post, the gitbook CLI is available on npm, however, do note that the site now talks about a version 2, which is not a CLI based offer but is more of a SaaS product with a freemium offering. You could also look at some other alternatives to do this, but the ease of use of the gitbook CLI is to be applauded.

How to get started with gitbook?

  1. Head on to the npm page for gitbook-cli and install this first.
  2. Create a new folder and in the console hit gitbook init
  3. Answer the questions and create your first markdown file
  4. In the console hit gitbook serve and in your browser go to http://localhost:4000
  5. That’s it

Core concepts

Keep in mind the following things –

  • The SUMMARY.md maps to the sidebar on the left hand side. This can be styled and the content of this file pretty much decides the navigation of your gitbook
  • gitbook is extendable through the config file – book.json, not just in look and feel, but also using plugins. My must plugins are – ["collapsible-chapters","insert-logo","image-captions","tbfed-pagefooter","copy-code-button","ga","sitemap","mermaid-gb3"]
  • Create sub-folders for different modules/services
  • Have a list of all entry points in SUMMARY.md
  • Maintain a CHANGELOG.md to have a history of major changes made
  • When a particular module becomes more complex, divide that into more parts and put those parts into nested folders. Do not forget to update the links in the respective .md files
  • Make the respective indents in the SUMMARY.md file as well

Building your gitbook

You can even host this somewhere (such as an S3 bucket or a static hosting). Simply execute the following command –

gitbook build

This will create a new _book folder in your gitbook folder. Host this as the static site.

That’s all there is to it. A simple and easy way to manage an evolving set of markdown files using gitbook.

Data, Reporting and doing what’s right

Data is being used to showcase that vaue has been generated. In order to do this, the most beautiful reports have to be eeked out. Now if you are a follower of Avinash Kaushik and don’t like data pukes, then you would be aghast at some of the reports that agencies in India tend to dish out.

I was, and 13 Llama Interactive was born out of that need to do better at both data driven marketing and reporting with transparency.

The road to hell is paved with good intentions

If you’ve been providing paid marketing services to clients for any extended period of time, you know that every person you work with has a different level of online marketing knowledge. Some people might be experienced account managers, others might know basics, while others still might not know the industry at all. It can be easy…

via 5 Agency Reporting Tips to Prove Your Value to Clients — WordStream RSS Feed

Apparently “agency reporting” is a thing. This is where every week or every month, the agency that is handling the brand account (or the performance account if you may) sends across reams of PDFs (or excel sheets) that’s meant to prove that whatever hair brained plan that they had cooked up the last period has worked.

The most common method to justify existence is to keep throwing boatloads of data reports from all tools and then talk about worthless metrics. Each of these tools mentioned in the article that I have shared helps agencies do this at scale, effortlessly.

Is too much data a bad thing?

It can be. If all that data is leading to Analysis Paralysis … or if it leads to falling in love with data analysis itself and forgetting real business outcomes (the reason why you got money for funding the collection of all that data).

If no one is using this mountain of data for solving problems, then it’s better that the data not be collected at all.

Yes, you are letting go of possibilities, but so be it. The damage to the business by wasting resources on gathering more liabilities instead of assets is much worse.

That’s what creates a paradox. Should we or shouldn’t we collect data?

Here’s a great video from Superweek that makes the case pretty well.

Data the new Oil

Any analysis team would work day and night to justify the reason for their being. There are enough articles being shared on the internet on arriving at a Return on Investment for Analytics (RoIA). However, the main service that any of these teams did was to crunch business data into A-has. This hasn’t changed over the years, and a lot of analysts derive job satisfaction through this very hunt for the A-ha! from their audiences.

The switch to being a core business

Data and business analysis was until now a support function, which needed business data in order to thrive and be effective. Aside from very few models (those that sold business critical data such as ratings, organizational data, etc), the data was never used as the primary product.

There was always a pre-activity and an analysis activity for that data to be useful. However, over the years I am seeing that has changed. Data is now being presented and sold as the main product.

Data as the product

Those of you who know Bloomberg, Hoovers, S&P or CRISIL, would know that data as a product business model works. Now that you know the pattern, let’s take a look at how this business model works.

Data collection as a ancilliary service

There is one function of the business which works with the entire industry it is catering to, to collect data. This more often than not is made available as a freemium or free service.

Some examples of this would be – Alexa Certified metrics, Google Analytics, Walnut app, Swaggerhub, etc.

You get the general idea here. If a good product or service is offering you a free plan, more often than not the data you are entering on that platform would be mused for multiple usecases. Not just for your primary use case.

Data aggregation and visualization

This is akin to the marketing function, and most probably gets a lot of early adopters talking good things about the product.

E.g a blogger singing paeans about Google Analytics, an industry benchmark visualization being shared, data report about a competitor, etc.

This way, the inherent value in the data is presented.

Data access and pricing plans

This is how the business is monetizing the data. By selling access to it. Often on a pay per use basis, or a per data point basis. Note, there might be multiple reports given to the user, however the user has to do the analysis on their own.

E.g SEMRush, SimilarWeb, Alexa, etc.

Wait, these are all old products

Yes. They have been around for quite some time. However, I am seeing that other industry are also copying this model. I recently spoke to someone in the pharma industry who was selling aggregated prescription data to pharma companies.

The credit industry has already been doing this for so many years. TransUnion is a perfect example. In India, most working professionals are familiary with their CIBIL scores. What few people realize that CIBIL is a TransUnion company. Similarily, CRIF score (which is an alternative bureau) belongs to Experian.

What gets my goat in this scenario, is that the firm which is collecting data is based out of another country! This firm now claims to own and know the data of citizens belonging to another country.

Shut up and take my data

Let’s go back 300 years or so. The British killed the Indian textile industry by mutilating the weavers who used to make cloth. Then they bought the cotton and other crops at throwaway prices, that cotton is similar to the data that is being collected. The industry grade cotton which was then imported back in India is similar to the data aggregation and reports that are being sold.

The only difference is that 300 years back, we were scared of the East India Company. This time around, we are welcoming the data traders with open arms. Should we not be a bit more aware of who and how our data is being used?

The reason why EU is taking such a harsh stance with GDPR is a bit more clear. Where is the call for privacy and better data sharing protocols?