In November 2016 Google Data Studio became accessible to all users in India. Previously limited to US users and Google Analytics 360 premium subscribers, the product now allows anyone to create dazzling reports that can be shared with teams and clients. Here is how to get started.
Adding a Data Source
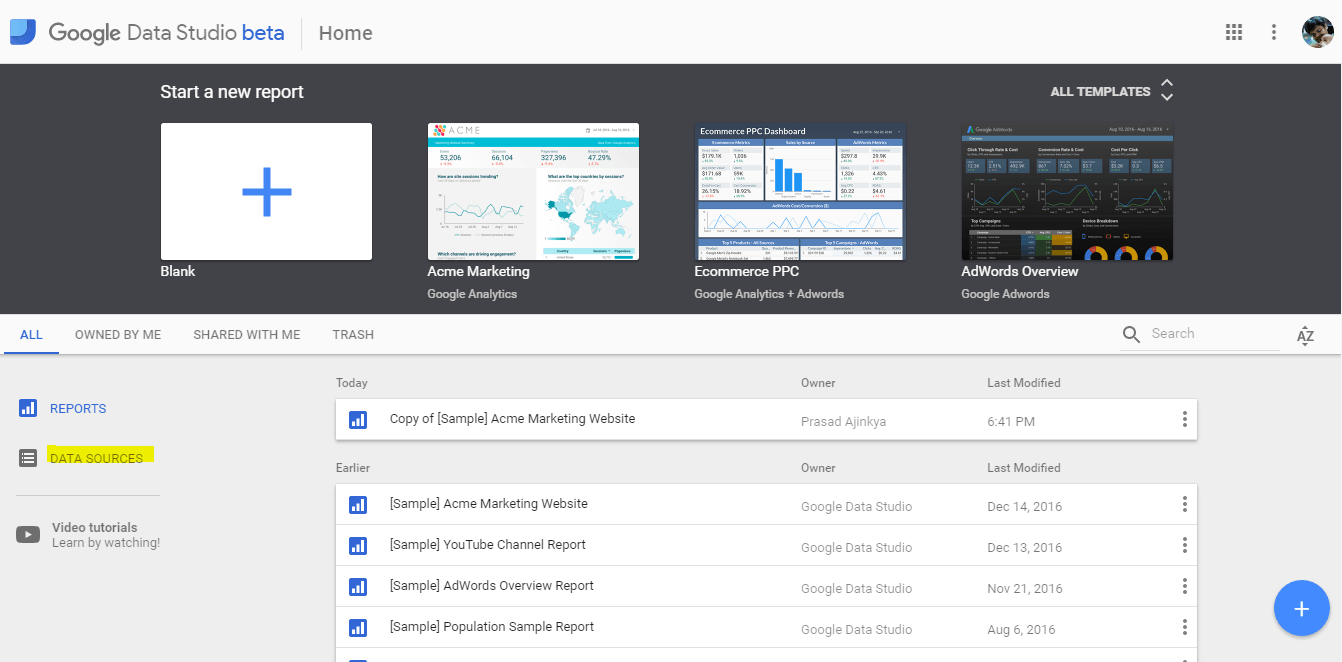
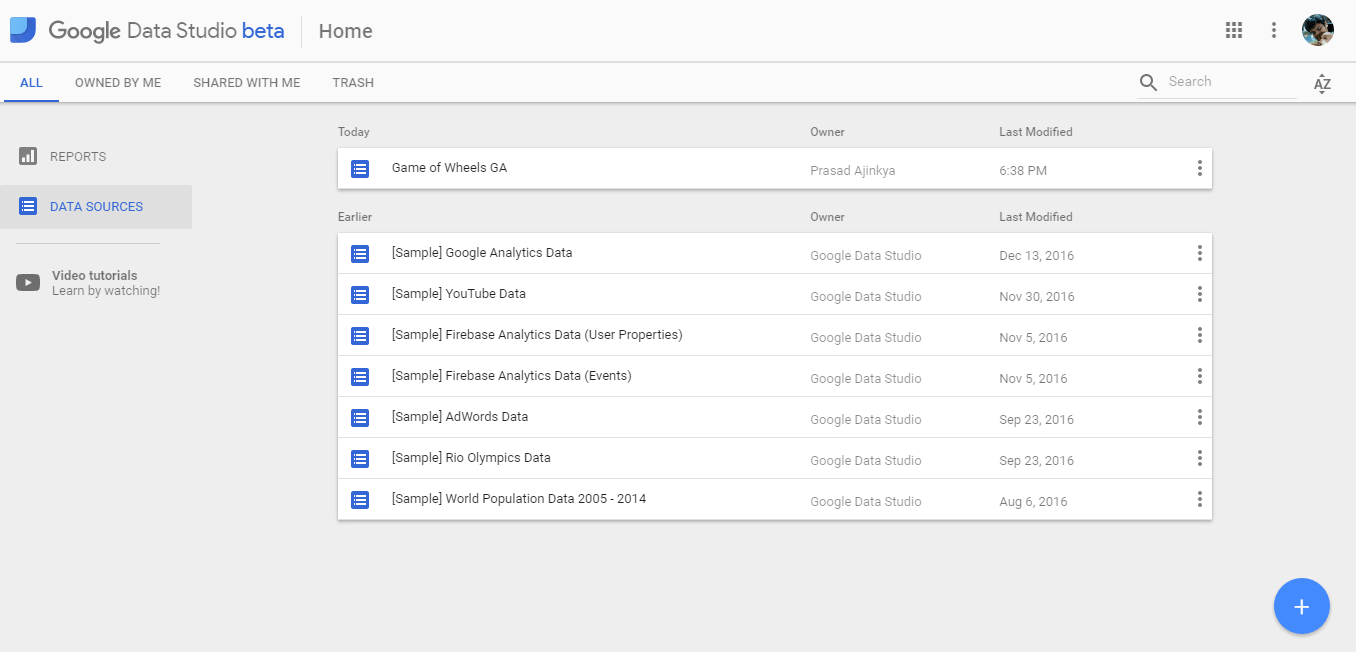
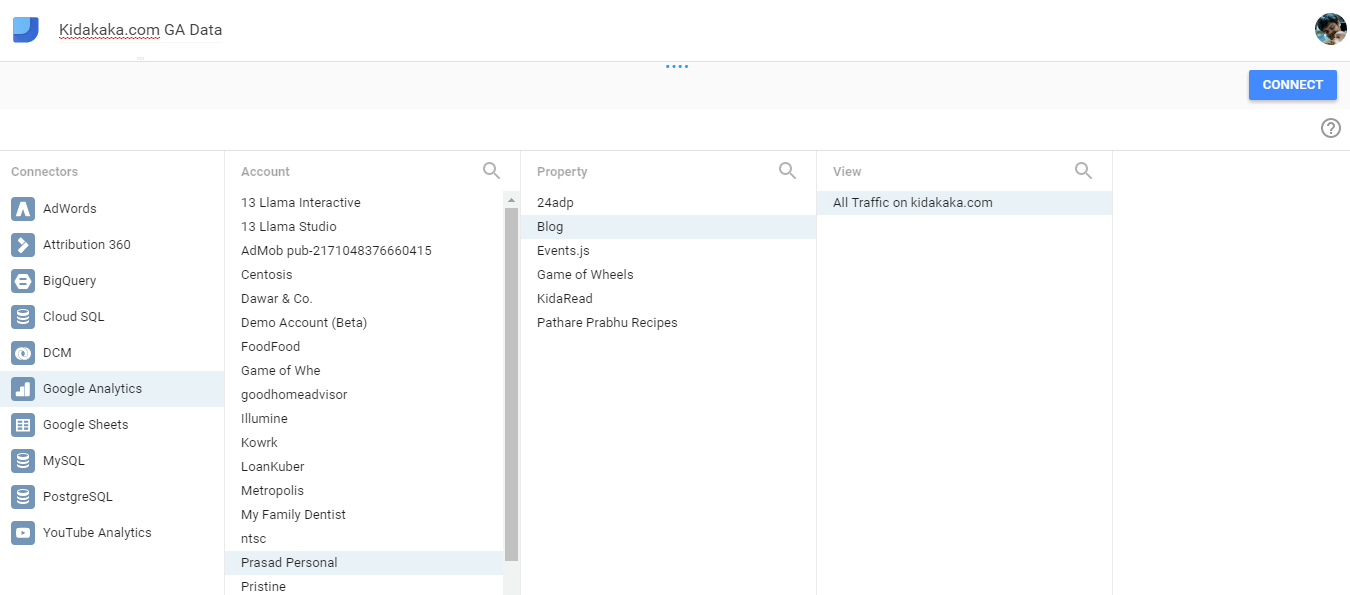
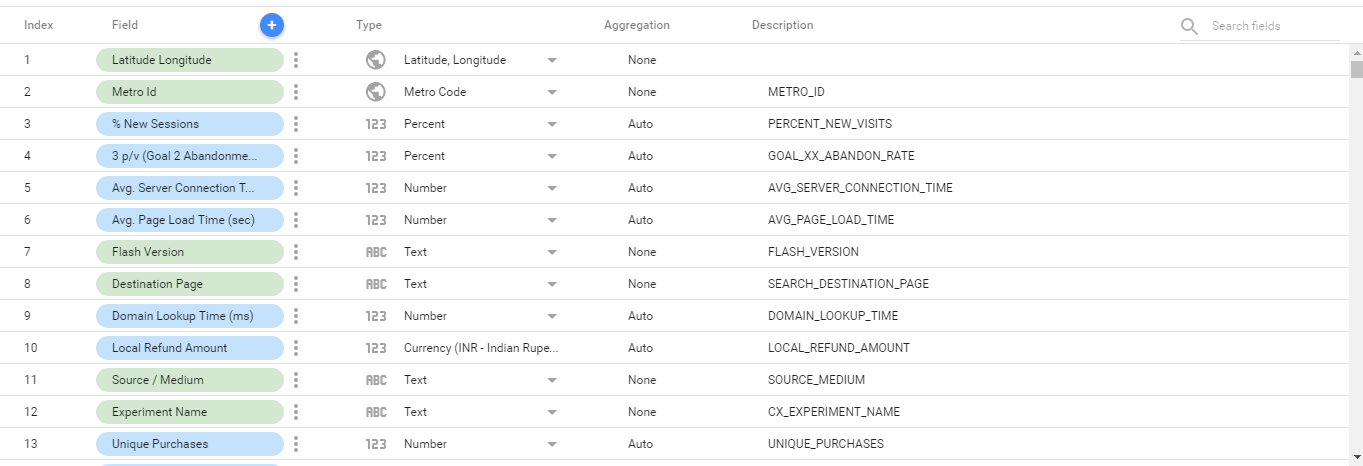
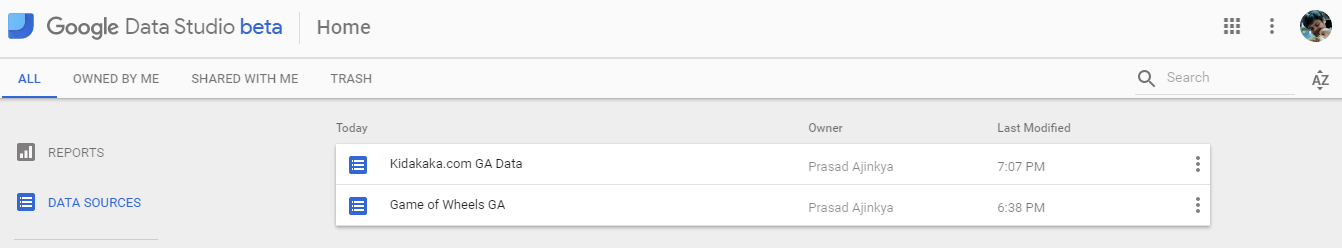
The first step is connecting a data source. Users can integrate Google Analytics, Google Ads, MySQL databases, or Google Sheets. After selecting a property, the platform displays all available dimensions and metrics for import.
Using Report Templates
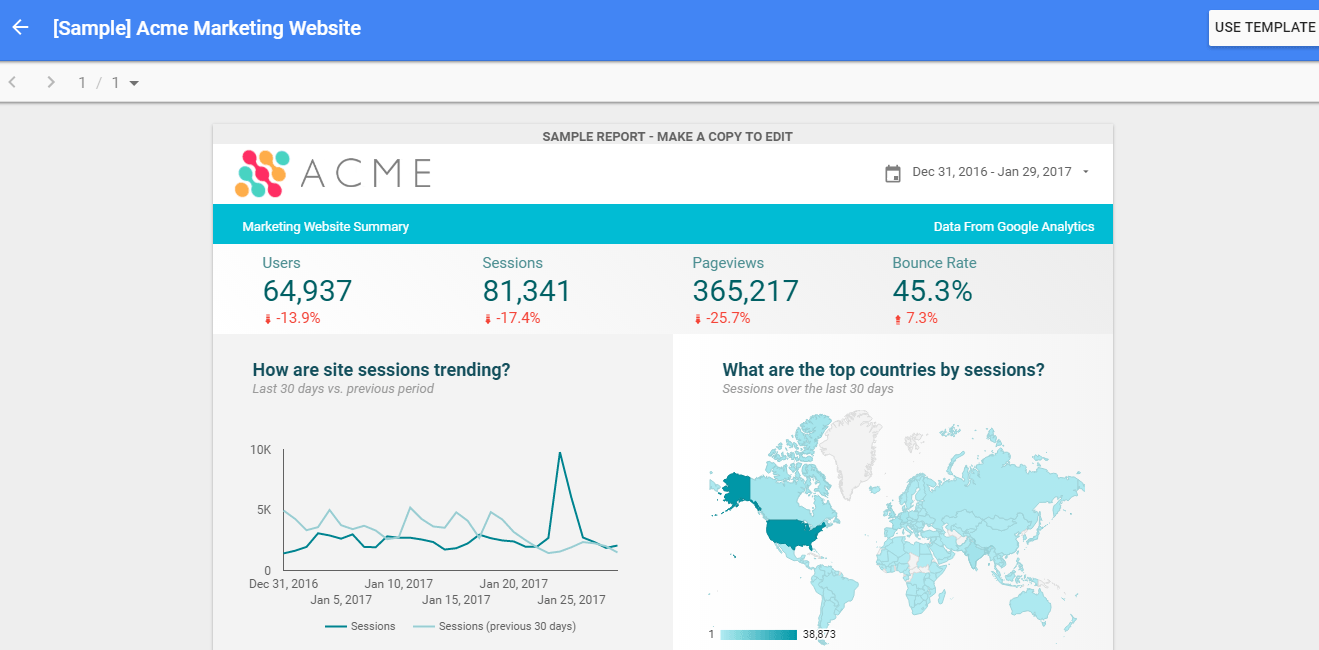
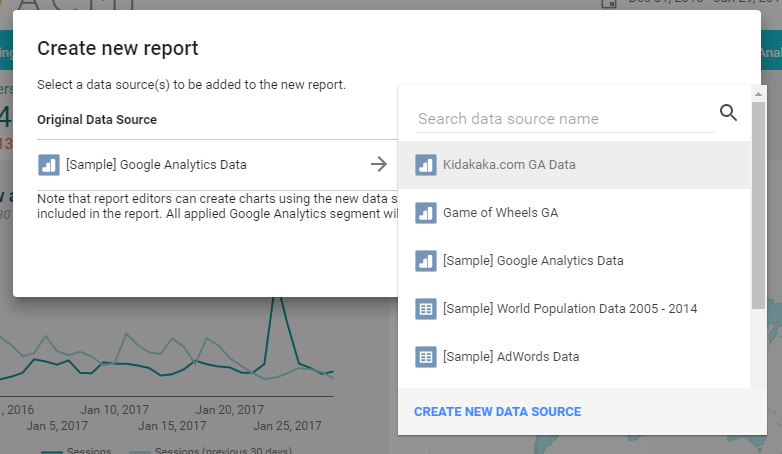
Data Studio offers pre-built templates. When applying a template, always select your own data source — otherwise the report will display sample data rather than your actual numbers. The Acme Marketing template is a useful starting point for most digital marketing reports.
Customising the Report
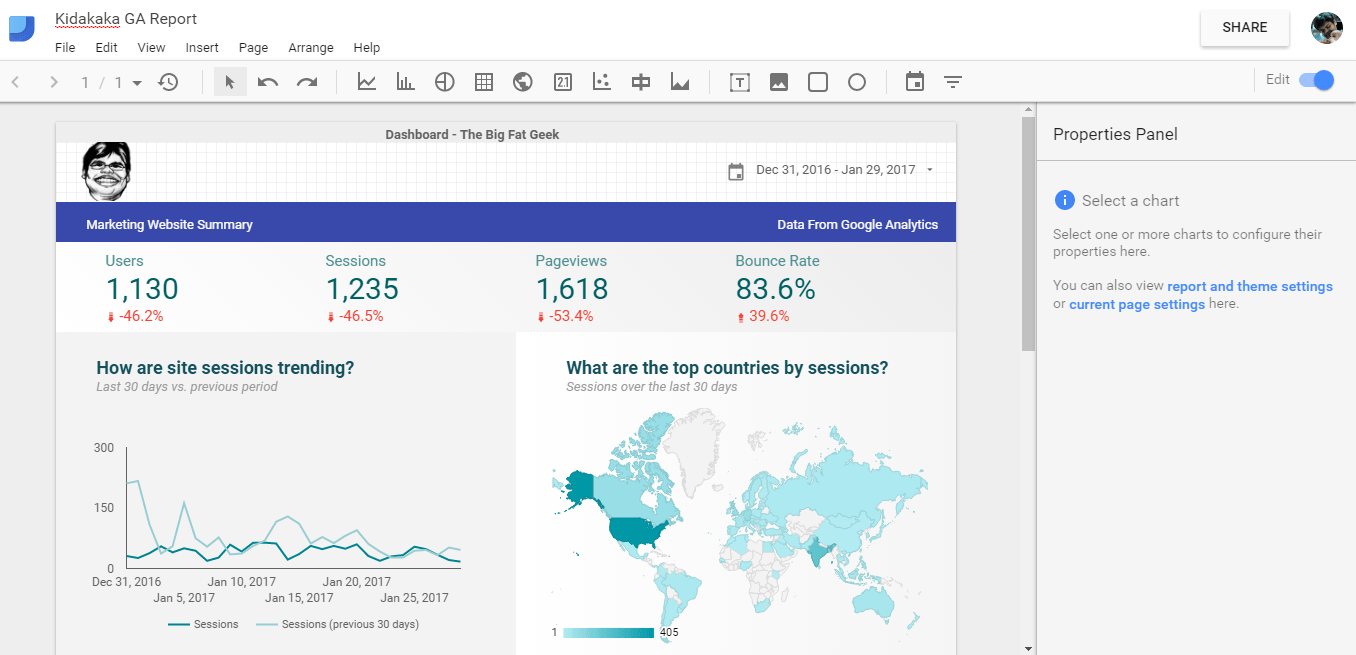
Templates can be personalised by modifying logos, header colours, and branding elements. I replaced the template logo with my own website branding in about two minutes. The drag-and-drop interface is genuinely accessible.
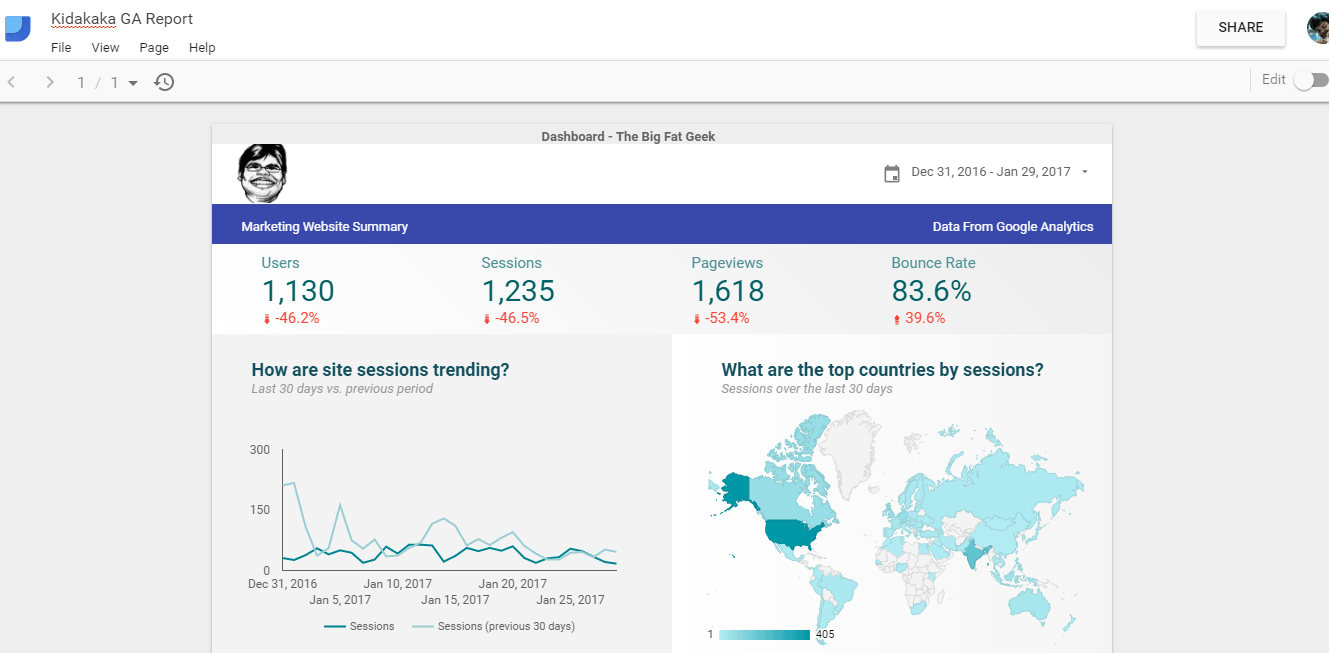
Real-Time Functionality
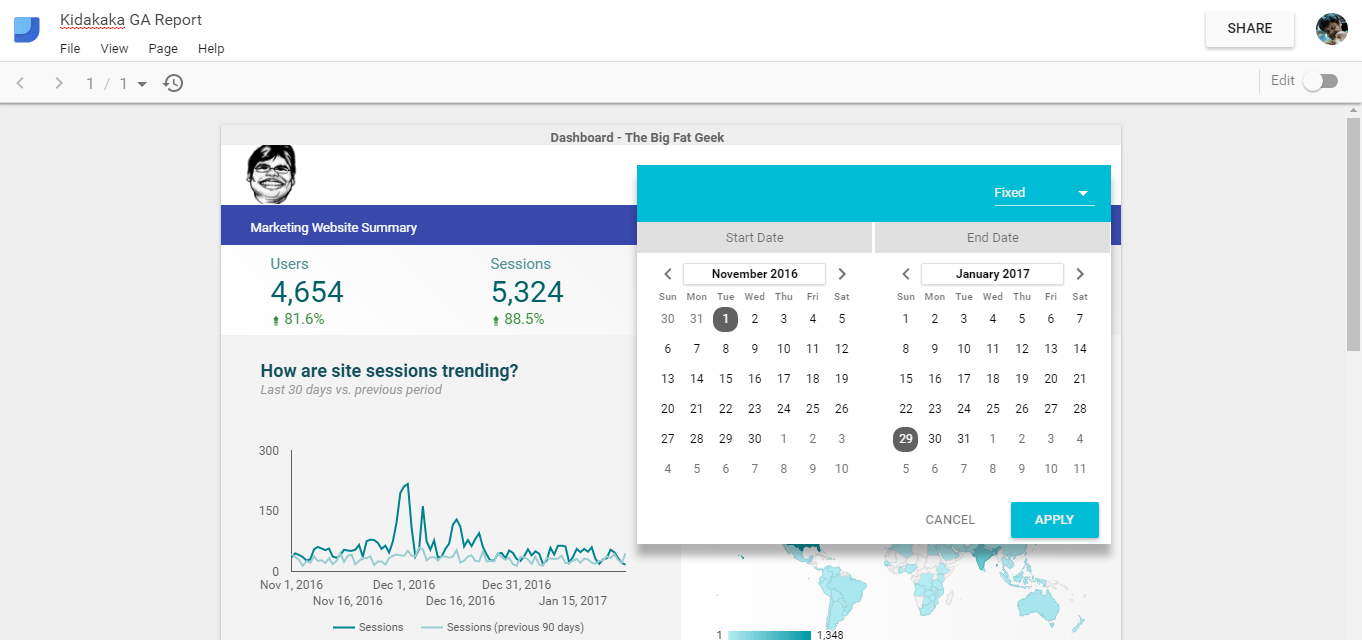
Reports connect to live data. Adjust the date range and visualisations update automatically. Reports can be shared with teams or clients while restricting access to underlying dimensions and metrics — controlled visibility without exposing sensitive information. For client reporting, this is a significant upgrade over emailing spreadsheets.